If you have created a Trellised chart, and are viewing it in the Standard layout, you can you can use the Trellis Axes formatting panel to show or hide labels, titles, and lines shown on the trellis axes.
- For more information about creating trellising charts, see Trellis Drop Zones.
- For more information about Standard and Custom layouts, see Custom Trellising.
Changes made to this formatting are applied to the x-axis or y-axis, depending on your selection in the Formatting Panel dropdown list.
What are Trellis Axes?
Trellis Axes provide more information about each row on a vertical trellis or each column on a horizontal trellis.
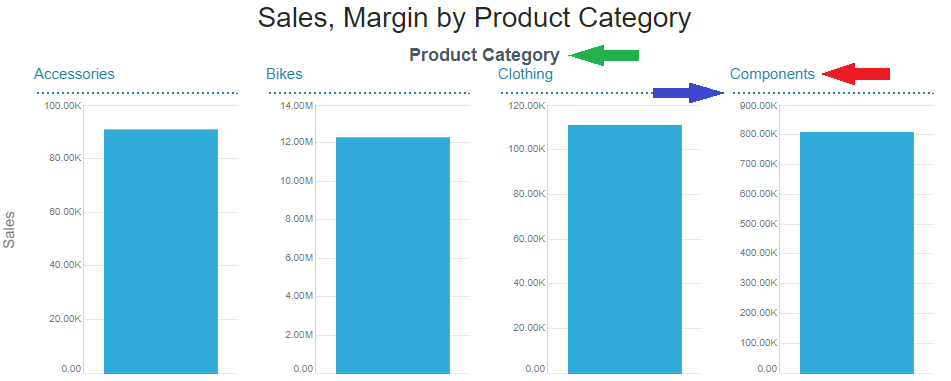
This example shows where your formatting changes apply when they are made in the X-Trellis Axis Formatting Panel:
- The green arrow points to the X-Trellis Title.
- The red arrow points to the X-Trellis Label.
- The blue arrow points to the X-Trellis Line.
Note: X-Trellis Axis information is always shown above the visualization, while the Y-Trellis Axis labels, titles, and lines are shown to the left of the Y-Axis information. For more information about configuring the axis formatting, see Axes.
Accessing the Trellis Axes Formatting Panel
There are a few different ways to access the Trellis Axes formatting options in the Formatting panel:
- Use the Formatting Selector to select either the X-Trellis Axis or Y-Trellis Axis on the canvas.
- From the Component ribbon, click Format Visual to open the Formatting panel, and then select X-Trellis Axis or Y-Trellis Axis from the main dropdown menu.
Trellis Labels
Update the X-Trellis Label or Y-Trellis Label options, changing the fonts and relative positioning of the standard Trellis text. Note: These changes apply to the default text to the left of Y-Axis on a standard vertical trellis, and above the visual on a standard horizontal trellis.
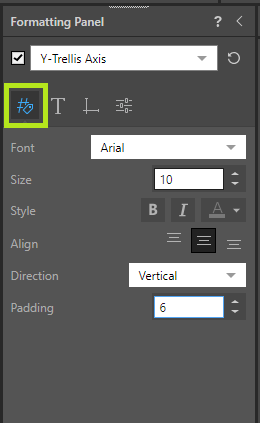
- Font: Change the font type.
- Size: Change the font size.
- Style: Change the font style (bold, italics, or color).
- Align: Align the trellis axis label vertically, to the top, middle, or bottom of the trellis axis.
- Direction: Change the direction of the trellis axis label. Direction is only configurable on the Y-Trellis Axis.
- Padding: Increase or decrease the padding around the trellis axis label.
Title
Show or hide the X-Trellis Title or Y-Trellis Title, supplying a custom value and customizing any font settings as required.
Note: The title is only shown where there is a Dimension (blue chip) on the X or Y Axis. The title is placed to the left or above any label text on the same axis.
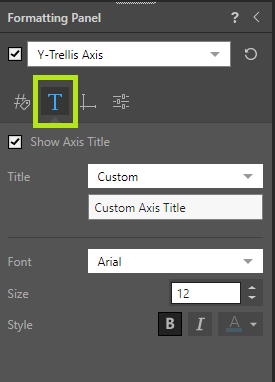
- Show Axis Title: Show or hide the title on the trellis axis.
- Title:
- Select Auto to automatically create a title from the name of the chip on the axis.
- Select Custom to specify your own axis title.
- Font: Change the font type.
- Size: Change the font size.
- Style: Change the font style (bold, italics, or color).
Axis Lines
Show or hide the X-Trellis Line or Y-Trellis Linethat separates the trellis axes information from the visual. Supply custom styling for your line as required:
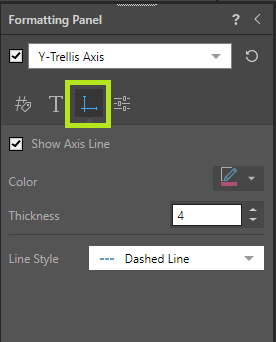
- Show Axis Line: Show or hide the trellis axis line.
- Color: Change the color of the trellis axis line.
- Thickness: Change the thickness of the trellis axis line.
- Line Style: Change the line to be solid, dashed, or dotted line.
Settings
Update the X-Trellis Settings or Y-Trellis Settings:
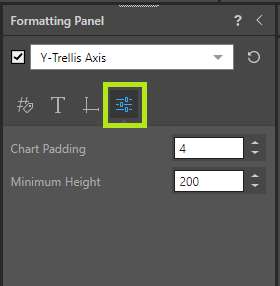
Note: Unlike the other settings in the Formatting panel, these settings apply to trellised diagrams that have either Standard or Custom trellis layouts. For more information about Standard and Custom layouts, see Custom Trellising.
Chart Padding
Increase or decrease the padding between charts along the selected axis.
For more information about Chart Padding, see Chart Padding.
Minimum Height
The minimum height determines the height of each chart in pixels. Since this value is in pixels, how it impacts the visual depends on your screen resolution. You can supply a value between 100 and 400 px as required. Selecting 400 will typically cause each row to fill the whole canvas, while 100 allows a few rows to be visible at once.
Note: The Scale to Fit option overrides any minimum height setting you have applied.